Grin
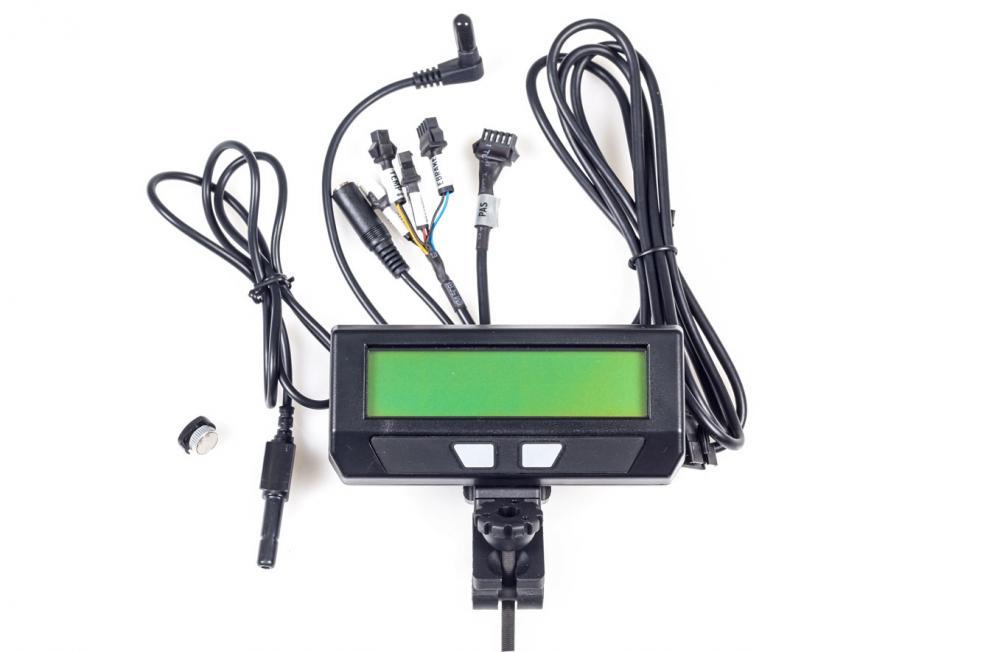
CA3-DPS - Cycle Analyst (Direct Plug-in with Speedometer Pickup)
CA3-DPS - Cycle Analyst (Direct Plug-in with Speedometer Pickup)
Couldn't load pickup availability
The Cycle Analyst is the first digital dashboard and battery monitor originally designed around the specific needs of electric bicycles. However, the flexible setup configurations, wide feature range, and affordable price have led it to widespread appeal in a range of other EV applications. From the dashboards of MIT's solar car, to record breaking electric motorbikes, to small trains, powered wheelchairs, and even sailboats and airplanes, the Cycle Analyst has become the e-meter of choice for keeping track of the vehicle's battery usage and performance characteristics.
- Thermal Rollback: A temperatures sensor input allows the V3 Cycle Analyst to scale back power as a motor heats up and prevent overheating damage.
- PAS Sensor: The V3 Cycle Analyst can take the pedal pulse inputs of almost any ebike pedal rotation sensor to display your pedal cadence. It can use this to provide automatic power whenever you pedal (PAS mode) .
- Torque Sensor: There is an analog input to sense a pedal torque sensor (such as the THUN bottom bracket), display your human power input, and give proportional no-throttle pedalec control.
- Ebrakes: A digital input for ebrake sensors to plug in directly to the CA3, without needing to run another set of cables all the way down the bike to the controller.
- Throttle Input Mapping: The CA3 can map your input throttle range to an output range suitable for the controller in order to eliminate dead-band zones at the beginning and end of the throttle motion.
- Throttle Modes: Setup your throttle in Pass-Thru mode for conventional voltage control, or have your throttle directly regulate the battery current or motor power instead.
- Throttle Ramps : Reduce the sensitivity and off-the-line kick of high power systems by setting ramp limits on the CA’s output throttle signal.
- On the fly Limit Adjustments: Use a potentiometer or multi-position switch to instantly adjust any of your current/power/speed or pedal assist limits.
- Mode Presets: Configure up to three distinct power mode presets each with their own limit settings and PAS/Throttle behaviors, and then easily switch between them with a double button press.
- Battery SOC and LVC: Accurate State Of Charge (SOC) estimator based on your cell chemistry and voltage. Configure up to two batteries each with their own details and Low Voltage Cutoffs.
Display #1 – Main Screen
The primary display screen shows at a glance all of the key info you would want to see from the bike. There is a battery fuel gauge in the top left, plus a readout of your pack voltage, speed, and battery power draw. The button right corner toggles between showing your accumulated trip distance and accumulated battery amp-hours, and if a temperature sensor is enabled it will show the temperature too.

Meanwhile, on the bottom left there are two additional graphic blocks. A throttle slider icon shows visually where your input throttle is at, switching to a flashing mode if throttle auto-cruise is latched, and then to a brake lever if ebrakes are engaged. Adjacent to this is a human power indicator that works if you have a PAS sensor enabled, indicating either your human power or your pedal cadence.
Also note that if you exceed the speed limit, then the speed units will flash, and if you hit the battery low voltage cutoff then the voltage sign will flash. If you are below the minimum start speed, then the speed number itself will flash.
Display #2 – Electrical Only
 The 2nd screen only shows electrical stats; Volts, Watts, Amps, and Amp-Hours. It is useful when using the CA on non-vehicle systems where all the additional details on the first screen are not relevant.
Display #3 – Human Power
 The 3rd screen is interesting for people who have a torque sensor in their system. The top line shows key vehicle stats: your voltage, amps, and speed, while the 2nd line displays your human power input and pedal cadence.
Display #4 – Energy Mileage
 The next display is the same popular readout from the V2 CA devices which shows the net watt-hours taken from the battery pack, as well as your energy ‘mileage’ in units of Wh/km or Wh/mi. This is the EV equivalent to gas mileage in L/100km, and the smaller the number the better energy economy and longer range you’ll get from a battery pack.
Display #5 – Human Stats
 Screen number 5 is a summary of the human power statistics for the trip, showing the total human watt-hours, along with the average watts and average pedal cadence. Note that the human watts are only averaged while the rider is pedaling, so if you coast or ride throttle only for a while this won’t reduce your average.
Display #6 – Regenerative Braking
 The relative benefits of regen are debated at length in the ebike community, and the point of this screen is to at least help provide analytic numbers to the discussion. On the left you will see the % by which your range has increased as a result of regen, and on the right it toggles between the total forwards and reverse amp-hours that were accumulated. (The Ah display on the 1st and 3rd screen is the net difference).
Display #7 – Max and Mins
 The next stat shows the electrical max and mins on the system. Usually the max amps isn’t all that interesting since it will be the same as your controller current limit, but the Amin will show the max regen current, and the multiplication of Amax and Vmin will typically coincide with the maximum power draw as well.
Display #8 – Speed Stats
 This one is self explanatory. Max speed, average speed, and trip time. In some cases you may see a somewhat wild value for MaxS, this can be the result of a double bounce in the speedometer pickup switch and adjusting the relative magnet and sensor positions can solve it.
Display #9 – Odometer
 Here you can see the same total trip distance as the first screen but with much greater precision, along with the lifetime odometer for the vehicle.
Display #10 – Battery Stats
 The battery statistics includes the lifetime cycles and amp-hours of the battery pack, along with a current estimate on the battery’s internal resistance in Ohms. The Cycles count increments every time you reset the CA by holding the right button, and both the Cycles and Total Amp-Hours are unique to each battery. So if you have both an ‘A’ and ‘B’ battery enabled, you can keep separate stats on each pack.
The battery resistance is computed on the fly by seeing how much voltage sag accompanies changes in current draw. This stat is useful, not only to quantify the performance of a pack but also to assess its aging and cold weather behavior. The internal resistance of most batteries will start to increase well before there is much noticeable decrease in the amp-hour capacity.
Display #11 – Diagnostics
The final display screen is most useful when initially setting up the CA for various feedback and control modes. On the top line you can see both the input throttle voltage from the user, as well as the output voltage that the CA is sending to the motor controller.

The bottom line has a row of limit flags showing which throttle limiting feedback loops are currently engaged. So if you are exceeding the speed limit, the ‘s’ becomes a large ‘S’, and similar flags for the current limit (a/A), power limit (w/W), low voltage rollback (v/V), and thermal rollback (t/T). If for instance you have the bike setup for proportional pedalec assist, then the commanded power limit of the CA is being set by your pedal effort, and so the power limit flag ‘W’ will be set showing that the CA is in a power limit control loop.
